Does this situation sound familiar? You have a complex analysis that must be finished urgently. The data was delivered late and its quality and structure are far from the expected standard. The time pressure to present the results is huge, and your SAS program is not giving you the expected output. It’s a tough situation and you have a feeling there must be better way, or something is not quite right with your code… so you reach for a SAS Press book!
A treasure trove of knowledge

These books are a lifeline for SAS users. From simple SAS programming, data processing, the full breadth of statistical analysis and machine learning, to the creation of graphics and reports, SAS Press books offer valuable ideas and code samples to help you work with SAS.
Written by SAS users for SAS users, many of these SAS Press books have helped me a lot in my 20-plus years as a SAS user and SAS programmer. They have maybe even "saved my Data Scientist life" once or twice.
The full list of my favorite books is very long, and would certainly exceed the scope of this blog. However, I would like to mention three short examples of some older books that are still relevant today and have personally benefited me greatly.
Example 1: Overlapping and transparent graphics

The time of clumsy and color-overloaded graphics is long gone. Our customers want to create representative graphics in a simple way. In their book Statistical Graphics Procedures by Example: Effective Graphs Using SAS®, Sanjay Matange and Don Heath show many examples of how to do this easily.
In one example, the SGPLOT procedure was used to display two overlapping histograms with 50% transparency and mark the most important areas with reference lines.
Example 2: Data aggregation for multiple BY groups
Data aggregation is a common topic in customer inquiries like this: "I want to aggregate data and get the sums or averages not only for the lowest level of detail, but all combinations automatically." In his book Longitudinal Data and SAS®, Ron Cody illustrates how to do this with the MEANS Procedure. He also shows you how to create an easy-to-read TYPE variable that tells you which group combination in each row has just been aggregated.
The graph below shows the analysis results of the mean body weight of patients after TREATMENT, STAGE, SEX, and CENTNR for different group combination3-means_tabelleations.
The _TYPE_ variable shows which group combination the results represent.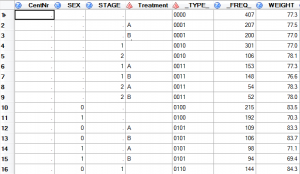
◾0000: averages over all observations
◾0001: Mean values separated according to TREATMENT A and B
◾0101: Mean values separated by gender (male, female) and Treatment A and B
◾ ...
Example 3: Your personal SAS Enterprise Guide

SAS Enterprise Guide, with its programming capabilities and ready-made tasks, remains one of the most popular front-ends for SAS users. Chris Hemedinger's Custom Tasks for SAS Enterprise Guide shows how to customize SAS Enterprise Guide and extend it to your custom tasks with custom functionality.
For users with less programming experience, you can provide predefined evaluation modules with a parameter mask.
Browse the bookshelf
The SAS Press online bookstore is open 24 hours a day. For each book you will find an excerpt, table of contents, and SAS example code and data. I am sure that you will find a book and think: "I could have already used this several times already." But during your next project you can say: "Now I know where to look."
For more lifesaving tips for data scientists you can also check out my recent title, Applying Data Science: Business Case Studies Using SAS®. In eight entertaining and real-world case studies, the examples combine data science and advanced analytics with business questions, illustrating them with data and SAS code.
Editor’s note: A version of this post was originally published in German on the Mehr Wissen blog.